hills$climb ##print a vector
 [1]  650 2500  900  800 3070 2866 7500  800  800  650 2100 2000 2200  500 1500
[16] 3000 2200  350 1000  600  300 1500 2200  900  600 2000  800  950 1750  500
[31] 4400  600 5200  850 5000
select(hills, climb)
                 climb
Greenmantle        650
Carnethy          2500
Craig Dunain       900
Ben Rha            800
Ben Lomond        3070
Goatfell          2866
Bens of Jura      7500
Cairnpapple        800
Scolty             800
Traprain           650
Lairig Ghru       2100
Dollar            2000
Lomonds           2200
Cairn Table        500
Eildon Two        1500
Cairngorm         3000
Seven Hills       2200
Knock Hill         350
Black Hill        1000
Creag Beag         600
Kildcon Hill       300
Meall Ant-Suidhe  1500
Half Ben Nevis    2200
Cow Hill           900
N Berwick Law      600
Creag Dubh        2000
Burnswark          800
Largo Law          950
Criffel           1750
Acmony             500
Ben Nevis         4400
Knockfarrel        600
Two Breweries     5200
Cockleroi          850
Moffat Chase 5000MAR 536: Lab 2
Dr. Gavin Fay
01/25/2023
Lab schedule
1/18: Introduction to R and R Studio, working with data
1/25: Intro to Visualization
2/01: Probability, linear modeling
2/08: Data wrangling, model summaries
2/15: Iteration
2/22: Creating functions, debugging
3/01: Simulation, Resampling
3/15: Flex: more modeling (brms, glmmTMB)
3/29: Spatial data or tidymodeling
Acknowledgements: Mine Çetinkaya-Rundel, Amanda Hart
Today
Datasets
- hills (Review from last week)
- lake Laengelmavesi dataset
- gapminder
- loans
- palmer penguins
Topics
- Review, more data structures
- Plotting in R
Review, data types
Review, data exploration
# Short data summaries
mean(hills$time)
[1] 57.87571
# Look at format
tail(hills) # last 6 rows
              dist climb    time
Acmony         5.0   500  20.950
Ben Nevis     10.0  4400  85.583
Knockfarrel    6.0   600  32.383
Two Breweries 18.0  5200 170.250
Cockleroi      4.5   850  28.100
Moffat Chase  20.0  5000 159.833
# General summary good for a quick look at large data sets
summary(hills)
      dist            climb           time
 Min.   : 2.000   Min.   : 300   Min.   : 15.95
 1st Qu.: 4.500   1st Qu.: 725   1st Qu.: 28.00
 Median : 6.000   Median :1000   Median : 39.75
 Mean   : 7.529   Mean   :1815   Mean   : 57.88
 3rd Qu.: 8.000   3rd Qu.:2200   3rd Qu.: 68.62
 Max.   :28.000   Max.   :7500   Max.   :204.62
Review, data exploration
# subset data frames
# races with distance>=10 miles, >4000 ft
rownames_to_column(hills, var = "race") %>%
  filter(dist >= 10, climb > 4000)
           race dist climb    time
1  Bens of Jura   16  7500 204.617
2     Ben Nevis   10  4400  85.583
3 Two Breweries   18  5200 170.250
4  Moffat Chase   20  5000 159.833
# mean of a vector
mutate(hills, speed = dist/time) %>%
  summarize(avg_speed = mean(speed))
  avg_speed
1 0.1472263
Missing values (NA).
Many functions do not handle missing values by default.
Omit missing values.
na.omit(weights)
[1] 25 34 75 21 32
attr(,"na.action")
[1] 4 7
attr(,"class")
[1] "omit"
drop_na(penguins)
# A tibble: 333 × 8
   species island    bill_length_mm bill_depth_mm flipper_length_mm body_mass_g
   <fct>   <fct>              <dbl>         <dbl>             <int>       <int>
 1 Adelie  Torgersen           39.1          18.7               181        3750
 2 Adelie  Torgersen           39.5          17.4               186        3800
 3 Adelie  Torgersen           40.3          18                 195        3250
 4 Adelie  Torgersen           36.7          19.3               193        3450
 5 Adelie  Torgersen           39.3          20.6               190        3650
 6 Adelie  Torgersen           38.9          17.8               181        3625
 7 Adelie  Torgersen           39.2          19.6               195        4675
 8 Adelie  Torgersen           41.1          17.6               182        3200
 9 Adelie  Torgersen           38.6          21.2               191        3800
10 Adelie  Torgersen           34.6          21.1               198        4400
# … with 323 more rows, and 2 more variables: sex <fct>, year <int>
drop_na() removes rows with any missing values. This is not (often) what we want to do. The naniar package contains functions for treatment of missing values.
Categorical variables
Factors are vectors with discrete values assigned to each element.
Can specify a categorical variable as a factor using factor().
Numbers to factors
Categorical variables are often coded numerically.
To find the levels of a factor:
droplevels(myfactor) will remove unused levels.
The forcats package is a great way of dealing with categorical variables. We’ll cover examples of its usage during the course.
Reading in data
So far we have either typed in data values, or used built-in datasets.
Lots of functions to read data from files, including:
scan()
- flexible, reads data into a vector.
- very fast, good for large or messy data.
read.table,read.csv
- easy to use, reads data into a data frame.
read_excel,read_csv(in tidyverse)
library(readxl)has many functions for reading from MS Excel spreadsheets
Using read_excel()
Read data from Finnish lake Laengelmavesi
Save Laengelmavesi2.xlsx to your computer.
Either to your project directory or create a directory called ‘data’.
library(readxl)
fish_data <- read_excel(
             path = "../data/Laengelmavesi2.xlsx",
                   sheet = "data", na = "NA")
# fish_data <- read_csv(file="../data/Laengelmavesi2.csv",
#                   header=TRUE,sep=",")
# R will look for the file in the working directory.
# Provide the directory path to the file if it is elsewhere
fish_data
# A tibble: 158 × 4
species length weight height
<chr> <dbl> <dbl> <dbl>
1 Bream 25.4 242 38.4
2 Bream 26.3 290 40
3 Bream 26.5 340 39.8
4 Bream 29 363 38
5 Bream 29.7 450 39.2
6 Bream 29.7 500 41.1
7 Bream 30 390 36.2
8 Bream 30 450 39.9
9 Bream 30.7 500 39.3
10 Bream 31 475 39.4
# … with 148 more rowsLab exercise 1/3 (Laengelmavesi + penguins)
Read in the data in the ‘data’ sheet of Laengelmavesi2.xlsx and:
- Display the number of observations for each species of fish. (hint: the function
count()will tell you how many rows)
- Find the overall mean lengths, weights, and heights of fish in the data.
- Find the range of the lengths of Perch.
- Calculate the mean length for each species.
- bonus With the Pike data, create a new factor for small and large based on the weights.
- Use the
ggpairs()function inlibrary(GGally)to create a pairs plot for the palmer penguins data. What are five things you learn about the data and the penguins from this view of the data?
Data visualization
Base graphics: plot()
plot() is the generic function for plotting R objects.
plot()is an overloaded function.
- what it returns depends on the type of objects that are given to it.
- there are versions of
plotthat provide useful outputs for manyRfunctions.
- e.g.
plot.lm()is a version that plots typical diagnostics from a linear model object. (but you still just typeplot(myobject)).
Plots are like onions…they have layers
Both base R and ggplot use a layers approach to plotting.
- Plot type
- Points
- Lines
- Colors
- Labels
- Styles
- etc.
ggplot2 \(\in\) tidyverse
- ggplot2 is tidyverse’s data visualization package
ggin “ggplot2” stands for Grammar of Graphics- Inspired by the book Grammar of Graphics by Leland Wilkinson
Grammar of Graphics
A grammar of graphics is a tool that enables us to concisely describe the components of a graphic
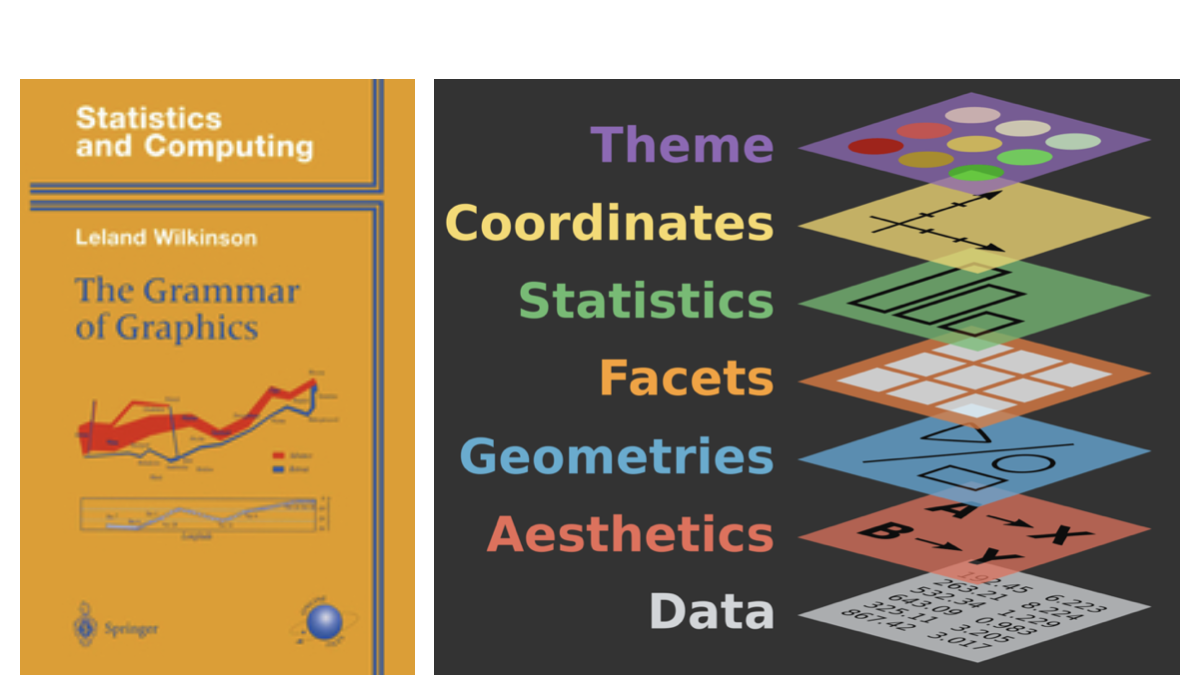
Hello ggplot2!
ggplot()is the main function in ggplot2- Plots are constructed in layers
- Structure of the code for plots can be summarized as
The ggplot2 package comes with the tidyverse
For help with ggplot2, see ggplot2.tidyverse.org
Palmer Penguins

ggplot(data = penguins,
       mapping = aes(x = bill_depth_mm, y = bill_length_mm,
                     colour = species)) +
  geom_point() +
  labs(title = "Bill depth and length",
       subtitle = "Dimensions for Adelie, Chinstrap, and Gentoo Penguins",
       x = "Bill depth (mm)", y = "Bill length (mm)",
       colour = "Species") +
  scale_color_viridis_d()
By default R uses variable names as axis labels. Use labs() to add text & captions, etc.
ggplot layers
To begin
– All ggplots begin with a call to ggplot()
Data
– data frame containing variables for plot
Aesthetics
– specify how data variables relate to graph properties – e.g. what goes on x & y axis, etc. – mapping argument passed to ggplot() via aes()
Geometry
– a call to a geometry (geom_) determines plot type – may require additional geometry-specific aesthetics
Other options
– summary statistics – adjust overall appearance (color, size, shape…) – add labels, captions, theme, etc. – faceting & coordinate system
Axis limits
R chooses x and y limits just larger than the range of the data.
To change the default x and y values use xlim and ylim.

Colors
Colors of points, lines, text etc. can all be specified.
If you want to map color to a variable then this should be done in the aes().
Colors can be specified as numbers, text string, or hex codes col=1 or col="red"
ggplot(data = fish_data, mapping = aes(x= length,
                                       y = weight)) +
  geom_point(col = "blue") + # Change point color to blue
  xlim(0, 50) +
  ylim(0, 800) +
  labs(title = "Laengelmavesi fish",
         subtitle = "MAR 536 Biological Statistics II, Lab 2",
         x = "Length (cm)",
         y = "Weight (g)",
         caption = "\nplot created by \n@gavin_fay")
Map color to a variable
ggplot(data = fish_data,
       mapping = aes(x= length,
                     y = weight,
                     col = species)) + # Color by species
  geom_point() +
  xlim(0, 50) +
  ylim(0, 800) +
  labs(title = "Laengelmavesi fish",
         subtitle = "MAR 536 Biological Statistics II, Lab 2",
         x = "Length (cm)",
         y = "Weight (g)",
         caption = "\nplot created by \n@gavin_fay")
Points
Use the shape and size aesthetics to adjust point type and size ::: {.cell}
ggplot(data = fish_data,
       mapping = aes(x= length,
                     y = weight,
                     col = species,
                     size = height)) + # Set point size proportional to body height
  geom_point(shape = 8) + # Change point type
  xlim(0, 50) +
  ylim(0, 800) +
  labs(title = "Laengelmavesi fish",
         subtitle = "MAR 536 Biological Statistics II, Lab 2",
         x = "Length (cm)",
         y = "Weight (g)",
         caption = "\nplot created by \n@gavin_fay")
:::

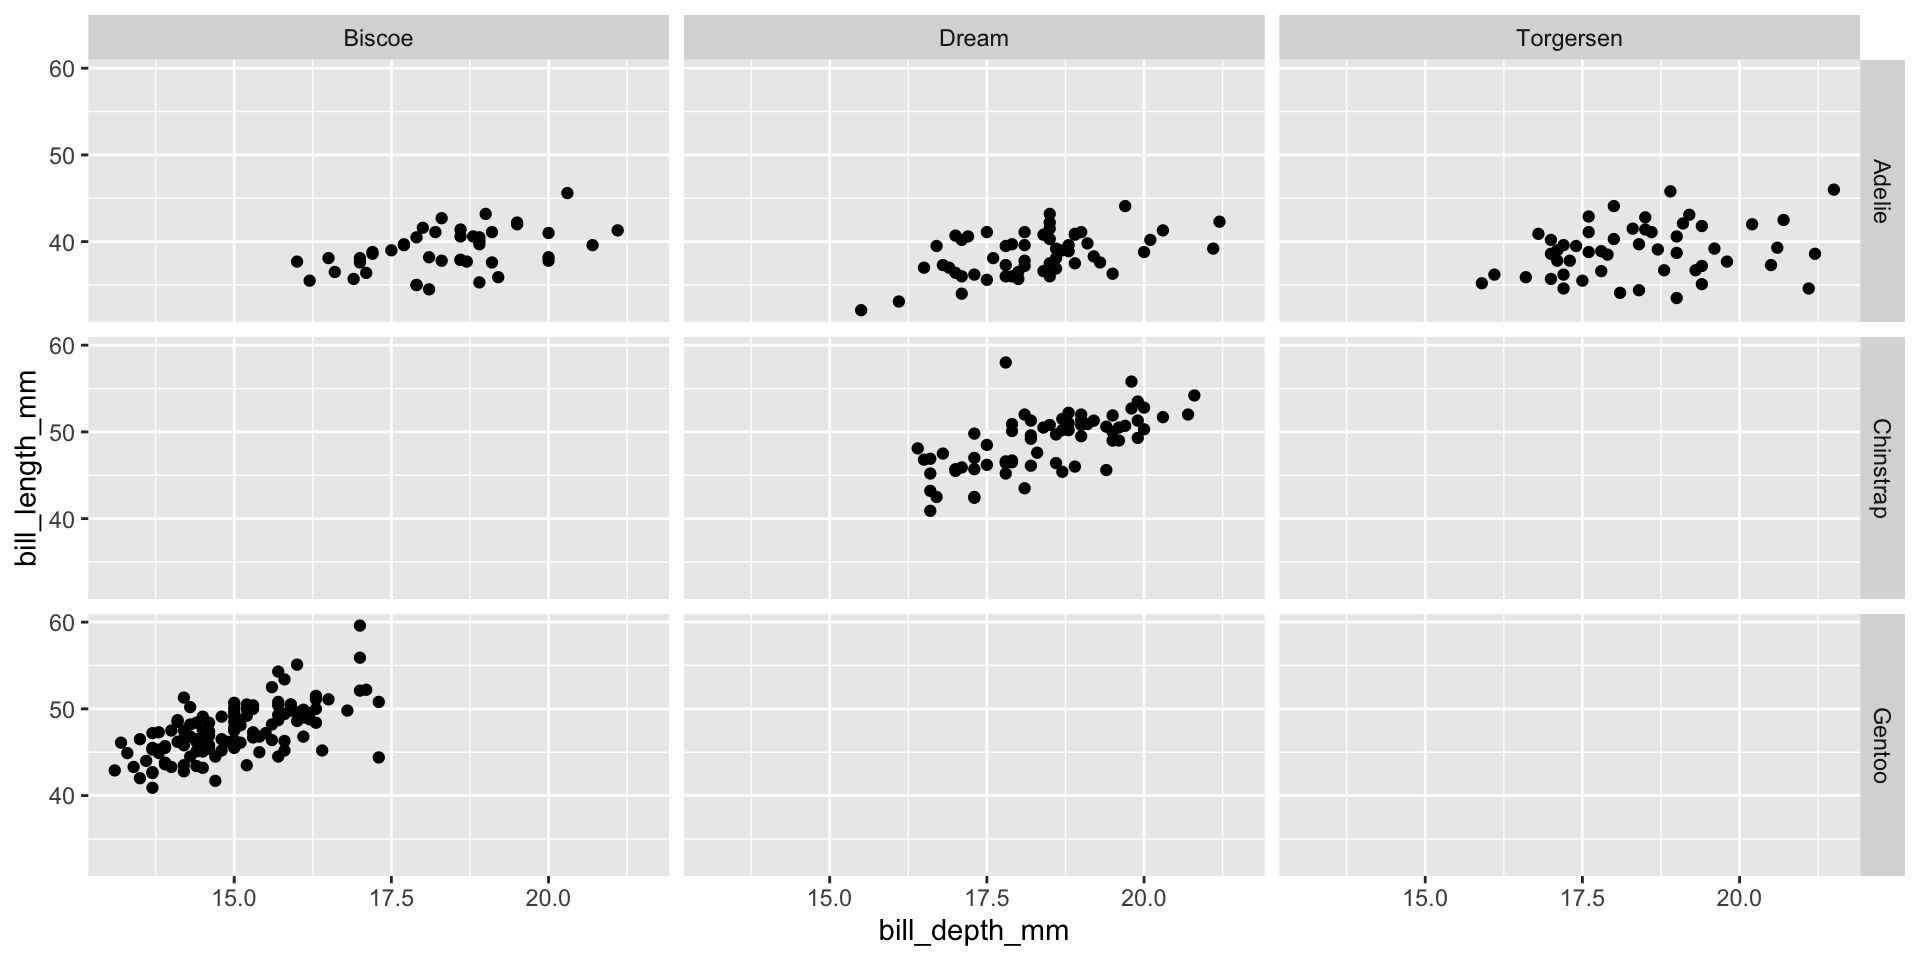
Faceting (small multiples)
- Smaller plots that display different subsets of the data
- Useful for exploring conditional relationships and large data
facet_grid([rows],[cols])
facet_wrap(~[var])

Lab exercise 2/3

- Use the
gapminderdata to replicate as close as possible this graph. (Try out different ‘themes’ with+ theme_XXXX())
- bonus plot time series of life expectancy by continent and country. (You can use
geom_line()to link points)
Data: Lending Club
Thousands of loans made through the Lending Club, which is a platform that allows individuals to lend to other individuals
Not all loans are created equal – ease of getting a loan depends on (apparent) ability to pay back the loan
Data includes loans made, these are not loan applications

Selected variables
loans <- loans_full_schema %>%
  select(loan_amount, interest_rate, term, grade,
         state, annual_income, homeownership, debt_to_income)
glimpse(loans)
Rows: 10,000
Columns: 8
$ loan_amount <int> 28000, 5000, 2000, 21600, 23000, 5000, 24000, 20000, 20…
$ interest_rate <dbl> 14.07, 12.61, 17.09, 6.72, 14.07, 6.72, 13.59, 11.99, 1…
$ term <dbl> 60, 36, 36, 36, 36, 36, 60, 60, 36, 36, 60, 60, 36, 60,…
$ grade <ord> C, C, D, A, C, A, C, B, C, A, C, B, C, B, D, D, D, F, E…
$ state <fct> NJ, HI, WI, PA, CA, KY, MI, AZ, NV, IL, IL, FL, SC, CO,…
$ annual_income <dbl> 90000, 40000, 40000, 30000, 35000, 34000, 35000, 110000…
$ homeownership <fct> MORTGAGE, RENT, RENT, RENT, RENT, OWN, MORTGAGE, MORTGA…
$ debt_to_income <dbl> 18.01, 5.04, 21.15, 10.16, 57.96, 6.46, 23.66, 16.19, 3…Variable types
| variable | type |
|---|---|
loan_amount |
numerical, continuous |
interest_rate |
numerical, continuous |
term |
numerical, discrete |
grade |
categorical, ordinal |
state |
categorical, not ordinal |
annual_income |
numerical, continuous |
homeownership |
categorical, not ordinal |
debt_to_income |
numerical, continuous |
Histograms
geom_histogram()
`stat_bin()` using `bins = 30`. Pick better value with `binwidth`.
Histograms and binwidth
binwidth = 2000

Customizing histograms
Fill with a categorical variable
Box plots
Use geom_boxplot().

Adding a categorical variable
Bar plot
The call to fct_reorder() will reorder the species according to a different vector, here the weight.

Segmented bar plot

Segmented bar plot

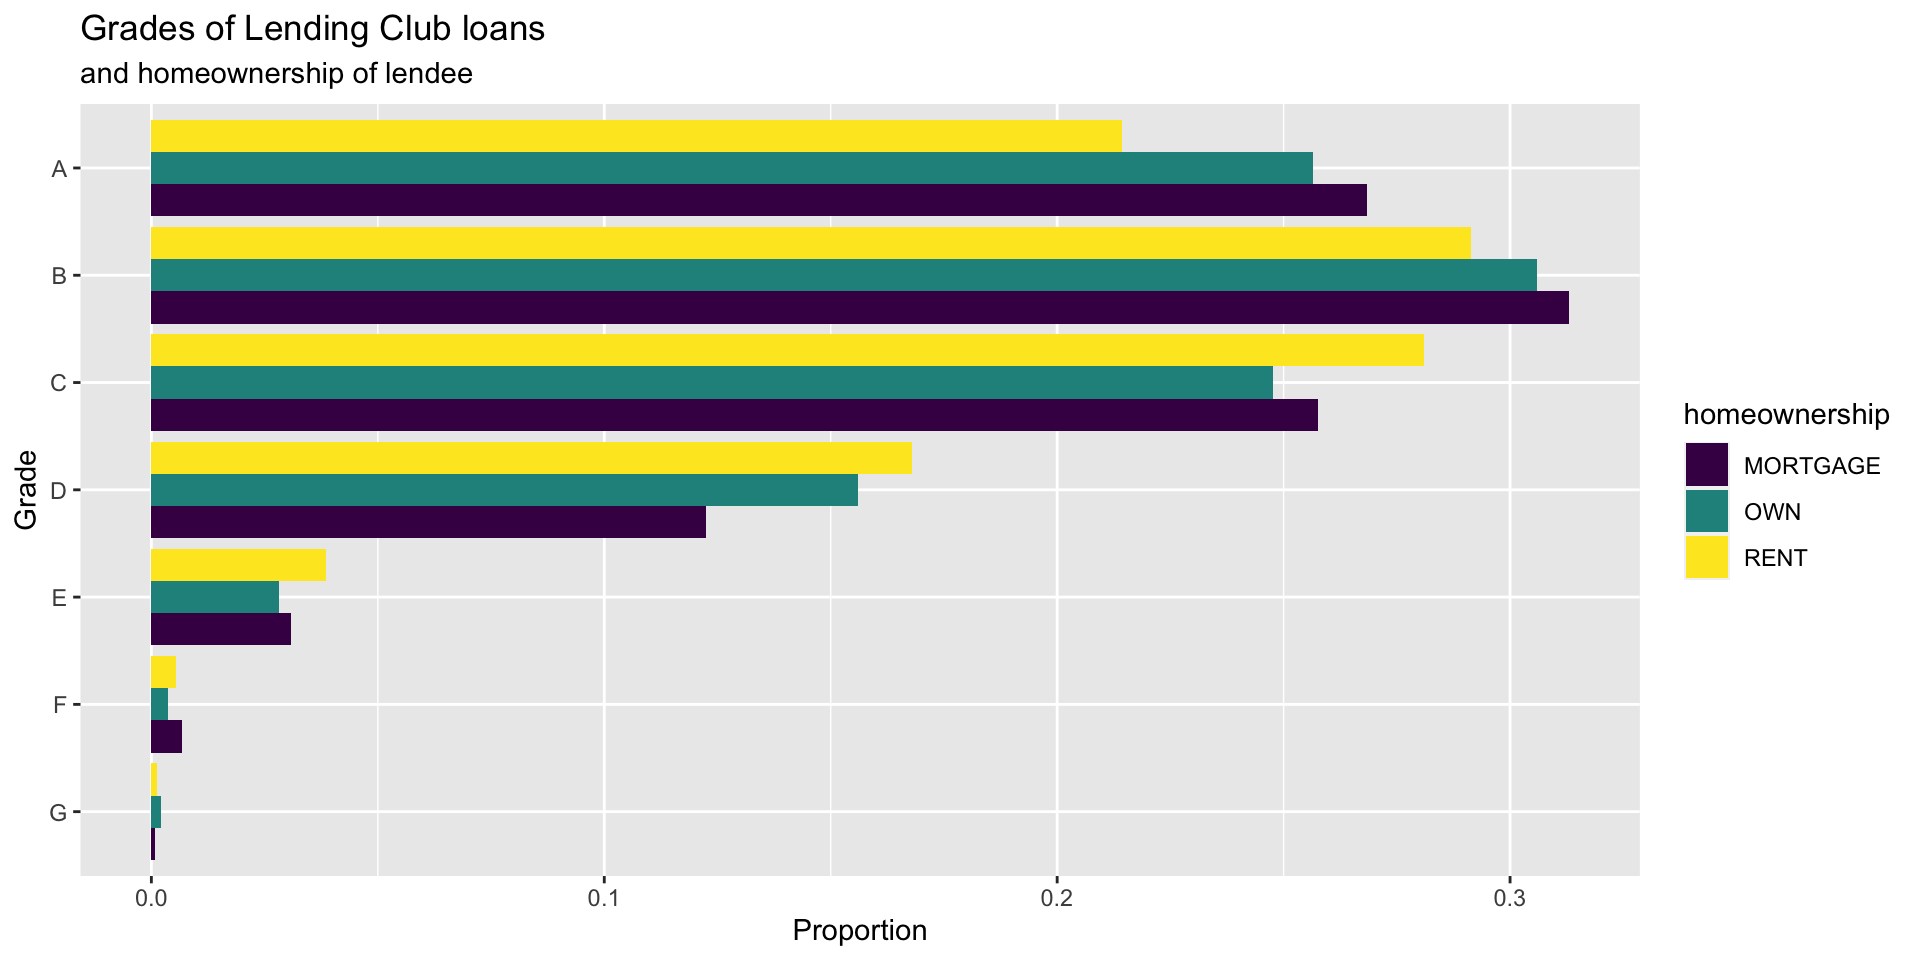
Which bar plot is a more useful representation for visualizing the relationship between homeownership and grade?


Customizing bar plots

Lab exercise 3/3 (Laengelmavesi revisited)
Use the data in Laengelmavesi2.xlsx to create the following graphs. Make sure to add axis labels and plot titles.
- Create boxplots and histograms of the length distributions for each species.
- Plot all the weights vs the lengths. Include enough information that the data for each species can be identified.
- Plot the mean weight of each species as a function of the mean length, with the species names and mean heights also indicated on the plot.
- Create one plot of the heights as a function of the lengths. Add a line separating fish with height greater than 20cm.
- bonus Add to your plot from step (2) the mean weight and length for each species.


